Figuring Cost Per Mile
Truckers must not be flying by the seat of their pants
When airplanes were a new idea, pilots were the cowboys of the air. Barnstormers would fly in and out the open doors of barns: they truly flew by the seat of their pants. They had a wicker seat, a control stick and a really great view… Life was grand! Over time, however, there were less and less of them. They were flying into the barns but not always coming out the other end.As the second generation of pilots emerged, they started developing tactics to stay aloft and remain alive so they could fly again tomorrow. These tactics often took the form of cockpit instruments that told them how well the equipment was running; fuel gauges, air speed indicators, oil pressure gauges, and engine temperature gauges. With the advent of each new gauge, the pilot’s life expectancy was extended. Today, instrument rated pilots make entire trips without seeing anything but their instrument panel. Everything they need to know to fly that plane safely to their destination is right there on their gauges and navigational equipment. The trucking industry has it’s own history of cowboys, and flying by the seat of their pants. However, as competition has increased it has become vital that independent drivers have a feel for how their operation is fairing at any given point in time. Where before just running might get you by and even make you a little money, today if you don’t run smart, you can run yourself right out of business before you even know it. One of the easiest ways of taking the pulse of your company is to track and control the costs of doing business. This will require some bookkeeping but they are figures you are already tracking for the IRS. Why not make them work for you at the same time? Once you know what your costs are, you can start taking steps to control those costs and that has a direct effect on your bottom line. Cost for operating a truck fall under two general categories; fixed, and variable costs.
Download spreadsheet (updated 11/15/2023)
Understanding the Cost of Operations
Comprendiendo el Costo de Operaciones
FIXED COSTS
Fixed costs expenses are costs you entail just having your truck parked out in your driveway. You have a daily exposure to them, rolling or not. There are some days of the year you may decide to make up later, like Christmas, Thanksgiving, and your birthday. What about days you sit idle waiting for a better paying load? You might be better off with a less productive load and not have to eat 2 or 3 days of fixed costs that just keep on adding up. In our example the annual fixed costs of $27,616 represent a $76 a day of fixed expenses. A load would have to pay out at $529 more to justify waiting a week for it. Once you know your fixed costs, then this is no longer a guessing game. You can decide how long you can afford to wait for a specific load based on the known cost of the wait. The biggest two items in this category are your mortgage on the truck and the variety of insurance coverages you need. Other items include your licenses, permits and accounting services.
VARIABLE COSTS
Variable costs are expenses that are directly related to operating the truck. Generally, the more you run the truck the higher these will go. There are some economies of scale, however, and some of these expenses will become less per mile as you increase your number of miles. Fuel, tires, maintenance, and meals and lodging are examples of variable costs.
COST OF OPERATIONS SHEET
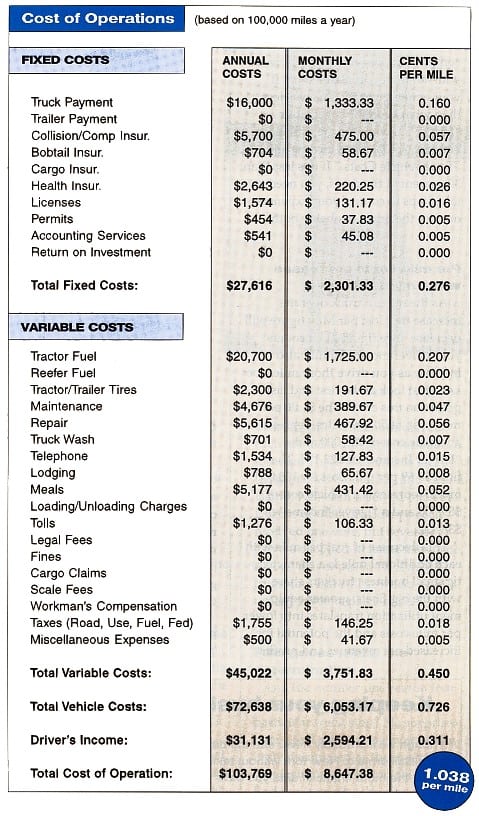
Our example (Figure 1) includes many expenses that truckers encounter in their businesses. It may not accurately reflect your operation, however, and you should adapt it to match your expenses before attempting to use it. Fixed costs and variable costs are separated out in the form and then combined in the item at the bottom labeled, “Total Vehicle Costs.”
The first column of figures contains the annual costs for each category. The second column divides the first column by 12 and gives you the monthly breakdowns. The third column is the result of dividing the annual costs by the number of miles run in the year. For our example we are assuming the truck was driven for 100,000 miles. So, since the annual mortgage payments on the truck were 16,000, we divide 16,000 by the 100,000 miles and we find the cost of the truck mortgage in $0.16 cents per mile. The Cost of Operation report is both a reporting and a planning form. It will report your operation’s expenses, but it allows you to play “If/Then” games with “Driver’s Income” and “Total Cost of Operation.” If you have determined a set driver’s income, you can tell what gross income level you must hit to support that income given your annual expenses. The “Driver’s Income” entry is the primary reason we’re going through all this in the first place. Some drivers will enter a set figure of what they want to earn. Others will pay themselves a percentage of the business they do, so the more gross income they generate the more personal income they make. As a general rule of thumb, the driver should earn about 30% of the total gross revenue of the truck. Since the expenses should be the other 70%, you can take the “Total Vehicle Costs”, divide by 70 and multiply the result by 30 to get the “Driver’s Income.” By adding the “Total Vehicle Expenses” and “Driver’s Wage”, you should have the “Total Cost of Operation” which should also be the total gross income for the year. If your actual gross income was more than what is on the sheet, congratulations, you made more for yourself than you planned on. If your actual gross income was less than what is on the sheet, your “Driver’s Income is the difference between actual gross income and “Total Vehicle Costs.” If it is less than 30 percent of the gross, you need to take steps to control your expenses or raise the gross, probably both.
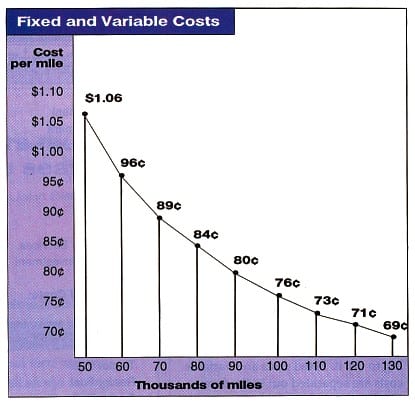
PER MILE COSTS DECREASES WHEN MILES INCREASE
As the miles a truck operates increases, the Cost Per Mile figure will decrease. (Figure 2) Of course your driver income should also increase as you drive those miles too. Let’s just look at the first and last points on this chart. The $1.06 per mile cost, at 50,000 miles, represents a vehicle cost of $53,000 and a “Driver Income” of $22,174. The final $0.69 per mile cost for 130,000 miles, represents a vehicle cost of $89,000 and a “Driver Income ” of $38,422. This decrease of cost per mile with each additional mile is a characteristic small business truckers share with the big fleets; greater equipment utilization translates into lower per mile costs and the potential for increased net revenues and profits.
OTHER BAROMETERS OF FINANCIAL HEALTH
The Cost Per Mile report is just one of many that can give a trucker an idea of what is going on in his operation. The beauty of these reports is they too use the same numbers you have already gathered, just assembled in a different way to give you perhaps a different financial view.
ROUND-TRIP PROFIT REPORT
The trip profit report summarizes the income and expenses of each round-trip made. This will average out the rate differences between legs of a trip and provides you with yet another view of how you make money. Also, when you begin to see that some trips are winners and some are losers, you can make a point of seeking out the winners, and avoiding the losers.
ACCOUNTS RECEIVABLE LEDGER
In today’s business climate you are more likely to get paid when you threaten to sue than on the date the money is due. Shippers and brokers that owe you money are using you as an interest-free bank when they go over their due date. If they really don’t have the cash on hand to pay you, they could borrow the money from the bank to pay you, but that costs them interest on the loan. Simply not paying you costs them nothing, and they save the interest on the loan. At the same time having a large accounts receivable can strangle your operation to death. Keep your terms in writing, but if a customer is historically late in paying, you have a couple of options. One is to charge him a higher rate to make up the difference, the other is to quote a higher rate for their “normal” payment and then offer a discount for payment within 15 days. If a good paying customer changes the way they are paying, ask around and find out what the real cause of the change is. There’s some wisdom in keeping your customer list diversified. Don’t let the failures of another company drag yours down with them. A good customer is one that has loads, and pays you on time.
FUEL LEDGER
Since fuel is your largest variable cost, small changes can have significant results. Making a change in your driving or equipment that adds as little as two-tenths of a mile more travel per gallon of fuel (i.e. 5.7 instead of 5.5 mpg) can translate into more than $2000 in annual savings. Fine tuning every cost in an operation can make a significant difference in its profitability.
DAILY OR WEEKLY COST OF OPERATION REPORTS
If monthly reports cover too many trips to be meaningful, then figure your cost reports weekly or even daily. The trick is to put the numbers into units that you can relate to, and from which you can recognize problems and identify solutions.